Logo Logo
MENU

Featuring

Scott Baker

View Profile

Based in Bermagui on the far south coast of NSW, Scott Baker is a multidisciplinary digital artist pushing pixels since the late 90’s when floppy disks were currency and CD-ROMs were too expensive.

Stage One

Tell us about the evolution of your concept through this creative development process.

Risk = Hazard X Exposure X Vulnerability

Scott previously worked on a project called ‘Blueprint for a Resilient South East NSW’. This project is to assist 11 councils and their communities to progress on their resilience journeys in the face of increased chance of impacts from natural disasters due to climate change.

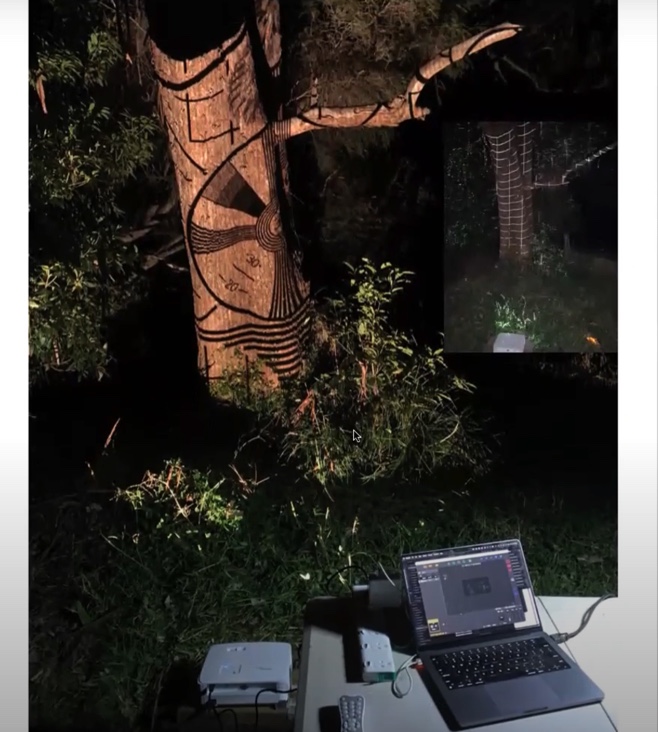
One of the aspects of this project is to support councils and communities to understand their risks through presenting climate change data for each local government area. The opportunity to explore a vision of the future in this region and access to these data sets provided an obvious nexus with my interest in video projection mapping.

Conceptual Development
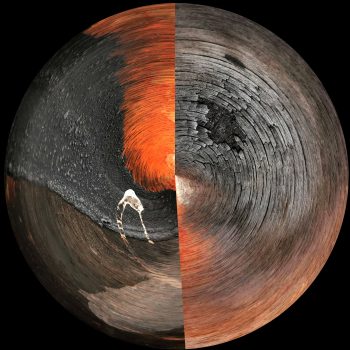
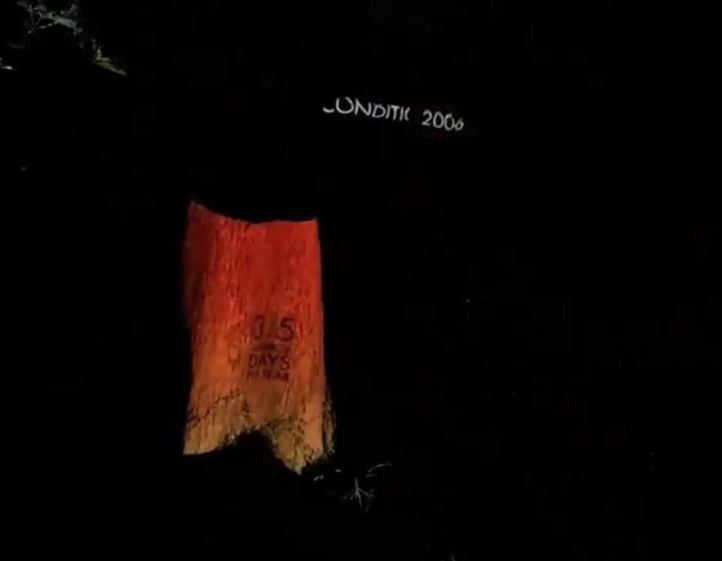
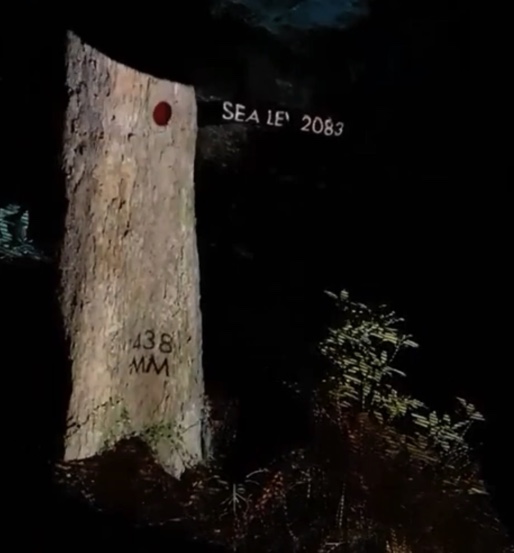
Starting with a spreadsheet of four sets of data – sea level rise, hot days (above 35), dangerous fire condition days and Forest Fire Danger Index (FFDI), I had to prioritise which sets to focus on even though there was the intention of developing all four. I chose sea level rise and dangerous fire condition days.

The initial intention was to try to move away from an infographic and attempt to simulate the changing climate.  I came across an archival video demonstrating wave theory in water. This 1960’s educational film held a snippet of a red ball in a wave pool that would work as a sea level rise device. Cutting a smooth loop from the  footage was challenging but the small glitch in the loop adds something organic.

I utilised a graph plugin for Illustrator to create the bars from the spreadsheet data. Decisions on typefaces were based on using the more utilitarian of fonts, something modern yet without embellishment. Futura was chosen for its simple, clean lines and variety of weights and styles. Graphs were built, preliminary animations created –  it was time to explore the site.

‘Navigate Arts’ in Tanja graciously invited me to be in residence for three days to finalise the creative development. I walked around and found a single tree whose presence, size and surrounding bush made it the one for this iteration. The next two days I used photos of the tree, both during the day and with a projected grid on it from the first night, to start to scale the animations of graphs and text.  Multiple details had to be considered,  such as being able to create a base where the projector could be removed and reinstalled each day, power runs, operations set etc all at 4 degrees Celsius.

“Regional Futures is an innovative program that puts as much emphasis on network development as it does creative development. It invests in people and processes before building things.”

– Scott Baker

Scott Baker

What experts/community members did you connect with during your creative development?

The climate change data was provided by climate scientists at ‘Risk Frontiers’. In addition to the data, there were conversations about data set selection and limitations of each set. For example it was important to choose data sets that have a high level of confidence in their predictions. Heat, fire danger days and FFDI all have high levels of confidence due to greenhouse gas measurements and predictions. Storms, east coast lows, rainfall and frost have lower levels of confidence in their predictions.

Describe where your work has reached in the development process and how you can see it progressing.

Data only tells a sliver of the story. Knowing that dangerous fire days are going to increase doesn’t take into consideration multiple overlapping disasters – impacts from displaced residents, loss of property and assets, deaths from extreme heat, mental health impacts from traumatic events, loss of wildlife and biodiversity etc etc. The data being presented 3 metres high has impact due to scale but integrating the systemic impacts of the data is where the work needs to go.

The work is designed to be translatable to different geographical regions, illustrating the risks to local audiences. But with further development there are opportunities to progress the work to bring in the human.

If you were to tell someone about the impact of Regional Futures and this creative development opportunity on your practice, what would you say to them?

I’d say that Regional Futures is an innovative program that puts as much emphasis on network development as it does creative development. It invests in people and processes before building things. The things are a natural byproduct that are richer from the community building themselves.

Links Fill 1 Copy 4 Created with Sketch.